Fixing That Mysterious Slow Request in Your Rails App
Even if your Rails app is humming along just fine most of the time, your users probably still occasionally experience painfully slow requests seemingly at random. While unexplained slowdowns can happen for many reasons, the most common root cause is excessive object allocations.
Here's the good news: there's something you can do about it.
Garbage Collection Pauses
When you create objects in Ruby, they eventually need to be cleaned up. That cleanup (garbage collection, or GC) usually happens far away from the code that created the objects in the first place.
Even worse, it's not uncommon for the garbage collection to happen in a completely different request. Each request has a small chance of tipping the scales and triggering a GC run, resulting in seemingly random slowdowns for your users.
While this explains the mystery, it doesn't help you resolve the problem. Fortunately, Skylight tracks object allocations throughout all of your requests, helping you zero in on parts of your app that are doing the most damage.
Tracking Object Allocations
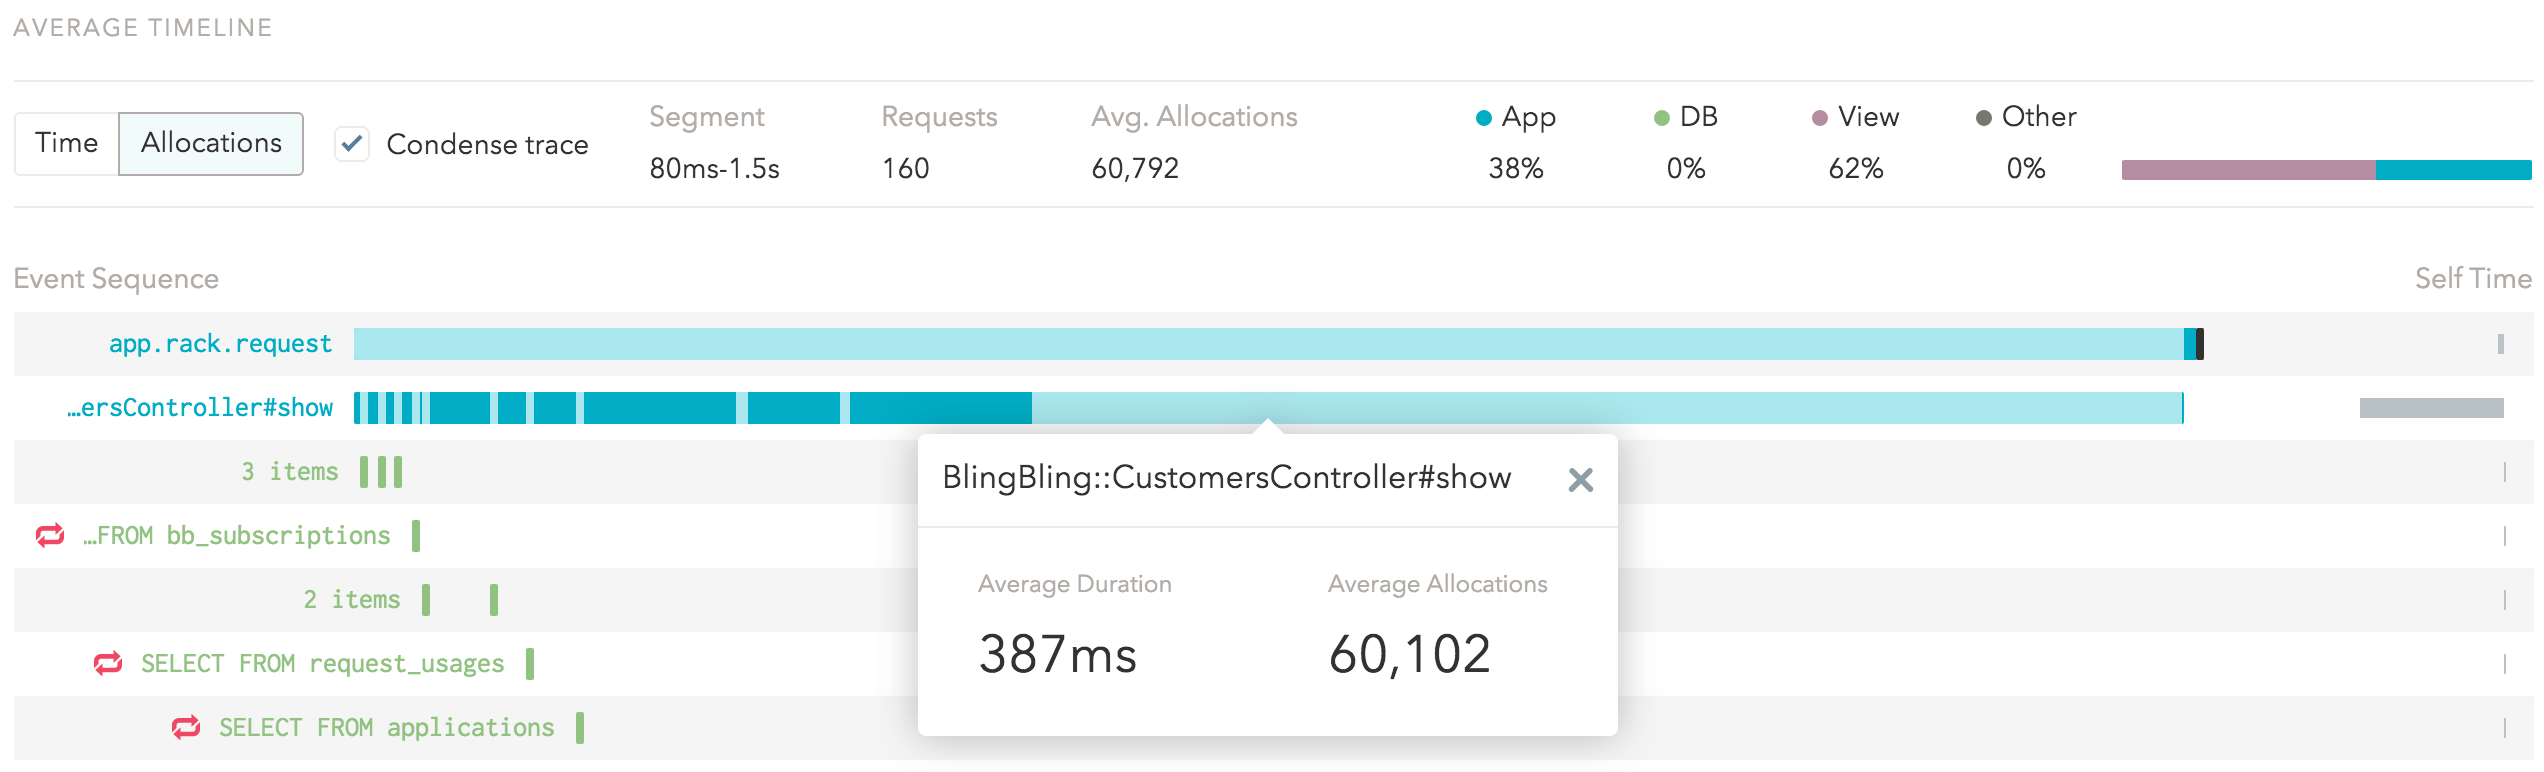
By default, Skylight focuses on how much time your endpoints and events are taking. When you drill down into an endpoint, you will see a representative trace for that endpoint where the larger bars represent events that took a long time to complete.
When you switch to allocations mode, the same trace will be re-scaled based on the number of allocations during each event, similar to how a cartogram re-scales a map by population so that states with more people appear bigger on the map.
Thanks to our featherweight Rust agent, we are able to collect this profiler-level information for your production apps at virtually no runtime overhead.
But wait, here is the coolest thing about this feature – since we automatically collect allocation data for all your endpoints and events, we'll use a pie chart icon to call out any endpoints with unusually high allocations in your endpoints list so that you know to give them a closer look:
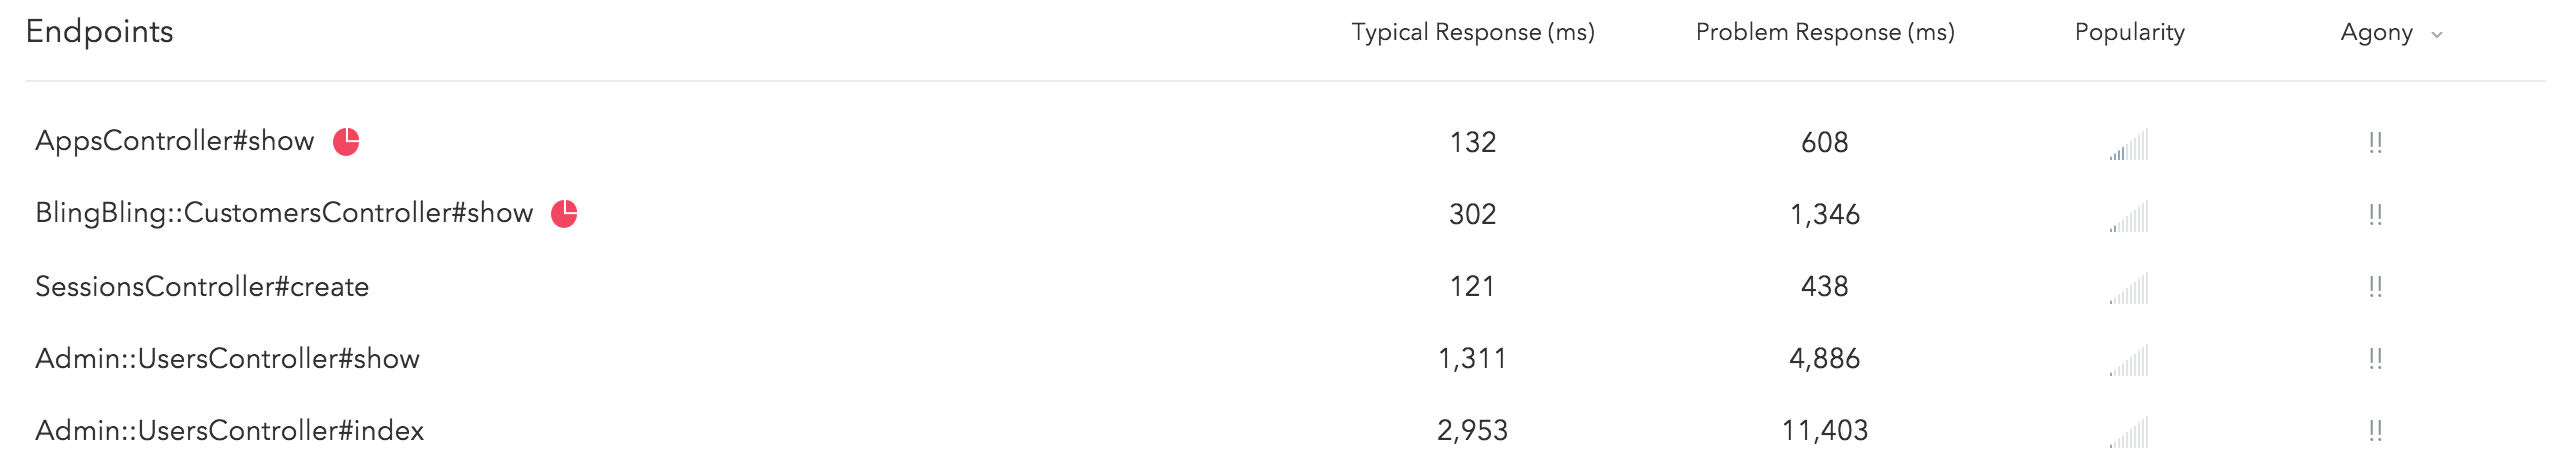
So the workflow for finding allocation hot spots is to look for the pie chart icon in the endpoints list. Then click on it to view the endpoint in allocations mode, allowing you to quickly identify potentially problematic events (i.e. the largest bars in your traces).
Fixing the Problem
Now that you've zeroed in on exactly which part of your app to work on, let's talk about the most effective ways to reduce allocations.
Before you spend weeks applying the tips in this section to every line of code, here's a disclaimer: reducing allocations is a micro-optimization. This means that they produce very little benefit outside of hot paths and they may reduce your future productivity (which may reduce your ability to do important macro-optimizations like caching). Be sure to use Skylight (or other profiling tools) to identify allocation hot spots and focus your energy in those areas.
What do we mean by hot paths? In short, loops. A piece of code that produces 200 objects might be completely fine if called occasionally; but if you call that code thousands of times in a loop, it can really add up. This is even worse if you nest loops inside of other loops, where a small piece of code can inadvertently be run hundreds of thousands of times.
All of these might seem obvious, but in a high-level programming language like Ruby, it's very easy for loops (or even nested loops) to be hidden in plain sight.
Here's a simplified example we saw recently when using Skylight to identify memory hotspots in our own app:
def sync_organization(organization)
  Mixpanel.sync_organization(organization)

  organization.users.each do |user|
    Mixpanel.sync_user(user)
  end
end
At first glance, you can see that this code has a loop, but it looks pretty innocuous. However, the sync_user method calls into a 30-line method that contains many lines that look like this:
user.apps.includes(:organization).map(&:organization)
Here, we are looping through each user in an organization, then looping through all the apps for each user. Now imagine that sync_organization itself is called multiple times in a single request. You can see how this can quickly add up.
This short line of code involves multiple hidden loops, allocating a large number of intermediate objects. When digging in to an allocation hot spot, the first step is to identify loops, and you should especially be on the lookout for these hidden loops, because they are very easy to miss.
Some examples of hidden loops:
- Methods on
Enumerableor other collections, likeeachandmap(especially when using&:, also known as the pretzel operator). - Active Record associations and other relations (like
user.appsin the example above, or callingdestroy_allon a relation). - APIs that work with files and other IO streams.
- APIs in other libraries, especially APIs that take collections and/or blocks.
Keep in mind that the problem is not the loop itself, but rather that the loop amplifies the effect of any repeated work. Therefore, there are two basic strategies to fixing the problem: loop less, or do less work in each iteration of the loop.
Iterate Less
One of the most common ways to reduce the amount of iterations you do in Ruby is to use Active Record methods to combine work and take advantage of your database for the heavy-lifting.
For example, if you're trying to get a list of unique countries across all your users, you might be tempted to write something like this:
User.all.map(&:country).uniq
This code fetches all the user records from your database, looping through them to create an Active Record object for each row. Next, it loops over all of them again to create a new array containing each country. Finally, it loops over this array to de-dupe the countries in Ruby.
As you can see, this approach ended up doing a lot of wasteful work, allocating many unnecessary intermediate objects along the way. Instead, you could make the database do the work for you:
User.distinct.pluck(:country)
This generates a SQL query that looks like:
SELECT DISTINCT "country" FROM "users";
Instead of making intermediate Ruby objects for every user and loops over those objects multiple times, this directly produces the array of countries in the database itself. This not only does less work in your application, but it also significantly reduces the work that your database has to do.
This technique works for updating and deleting too. Instead of iterating over the objects you want to change in Ruby:
User.where("last_seen_at < ?", 1.year.ago).each(&:destroy)
You can do the same thing in the database directly:
User.where("last_seen_at < ?", 1.year.ago).delete_all
This generates a SQL query that looks like:
DELETE FROM "users" WHERE last_seen_at < ...;
However, because the database is in charge of deleting the records, your Active Record validations and callbacks will not run, so you might not always be able to use this technique. This is also true about update_all.
If you find yourself looping over Active Record objects in Ruby, there is likely a way to shift some of the work to the database. The Active Record Query Interface guide is a good place to start.
Along the same lines, when looping through a large amount of Active Record objects, considering using batching APIs such as find_each. While they don't ultimately reduce the total number of allocations, they ensure that you are holding on to fewer objects at the same time, allowing the garbage collector to work more effectively. (Rails 5 will come with some even more powerful APIs in this department.)
Allocate Fewer Objects Per Iteration
If you have a loop in a hot path that absolutely must exist, you should try to find ways to allocate fewer objects inside each iteration of the loop.
The quickest wins here involve moving shared work outside of the loop and looking for seemingly benign constructs that need to allocate objects. Let's look at this hypothetical example:
module Intercom
  def self.sync_customers
    Intercom.customers.each do |customer|
      if customer.last_seen < 1.year.ago
        customer.deactivate!
      end

      if blacklisted?(domain: customer.email.domain)
        customer.blacklist!
      end

      log "Processed customer"
    end
  end

  def self.blacklisted?(options)
    ["hacked.com","l33t.com"].include?(options[:domain])
  end
end
In this seemingly simple example, there are multiple places where we are allocating unnecessary objects in each iteration:
- The call to
1.year.agocreates multiple new objects in every iteration. - The call to
blacklisted?function allocates a hash ({ domain: customer.email.domain }). - The call to
logallocates a new copy of the string"Processed customer". - The method
blacklisted?allocates an array (along with the strings inside it) every time it is called.
A slightly different version of this loop has many fewer allocations:
module Intercom
  def self.sync_customers
    inactivity_threshold = 1.year.ago

    Intercom.customers.each do |customer|
      if customer.last_seen < inactivity_threshold
        customer.deactivate!
      end

      if blacklisted?(domain: customer.email.domain)
        customer.blacklist!
      end

      log "Processed customer".freeze
    end
  end

  BLACKLIST = ["hacked.com","l33t.com"]

  def self.blacklisted?(domain:)
    BLACKLIST.include?(domain)
  end
end
Depending on how many customers this code is looping over, we might have saved a large number of allocations here:
- We hoisted
1.year.agooutside the loop, so we allocate only one shared copy for the entire loop. - We changed
blacklisted?to take keyword arguments, which eliminates the need for the hash since Ruby 2.2. - We moved the blacklist array to a constant, so it is shared across calls.
- We used
"string".freeze, which guarantees that a single string will be created and reused since Ruby 2.1.
The last point deserves a special mention: by guaranteeing the immutability of your string literals, Ruby can reuse the same instance of the string object across multiple calls. This essentially allows Ruby to hoist the string for you (similar to how we moved the blacklist into a constant) while keeping the string inline for readability.
The freeze call introduced some visual noise here, but this might soon be a thing in the past. Matz has announced plans to make this the default behavior in the long term. You will likely be able to start opting into this feature in Ruby 2.3. You can follow along here to track the progress.
We should also point out that regular expressions, integers (Fixnums) and most floating point values already receive similar optimizations on modern Rubies, so you normally wouldn't have to worry about hoisting them manually either.
Ship First, Optimize Later
Like many others in the Ruby community, we highly value developer productivity and writing beautiful, maintainable code. While it is very important to be mindful of performance when writing framework code, when it comes to working on our apps, we would rather spend our precious time (and brain cycles!) shipping new features instead of hoisting variables and bending over backwards to tear apart nested loops.
With Skylight, you can rest easy knowing that we will alert you to any potential performance problems, allowing you to focus your limited time on places where is matters the most.
Start using Skylight to find and eliminate memory hotspots. Sign up today and your first 30-days are free. Or, refer a friend and you both get $50 in credit.
Update on March 14, 2016: Screenshots were updated and some minor wording changes were made to reflect subsequent updates to the Skylight UI.