Visualizing Rails logs With Jupyter Notebook
Your Rails app appears to be humming along just fine. But then, out of the blue, one of your most important customers emails your support team: "the site is loading slowly - is something up"?
You frantically browse around the site, but everything seems fine. You double-check the charts: things look normal. Is the customer trying to trick you? Is monitoring broken?
In this post, I'll show how to slice-and-dice your Rails application log to uncover performance issues on the edges. With your new super powers, you'll be able to find that needle in the haystack.
The setup
This Rails log data analysis recipe has two parts:
- A couple of Ruby gems to log requests in a machine-readable format (JSON).
- Jupyter Notebook: an open-source web app I'll run locally to analyze the Rails logging data.
I'm going to use Python, not Ruby, for our data analysis. Python has an excellent collection of data science tools. My first exposure to Python was via Jupyter Notebook: you don't need to know the inner workings of Python to extract the data you need.
I'll start by updating my Rails app to log in JSON format.
Mind helping me tailor our content? Just click on your role:
• Junior Developer
• Senior Developer
• DevOps
• CTO
The Rails App
By default, Rails log files aren't machine-friendly. We can change that with 3 gems:
Lograge lets us shrink the large number of lines generated by the default Rails logger to log a single request into a single line:
method=GET path=/jobs/833552.json format=json controller=JobsController action=show status=200 duration=58.33 view=40.43 db=15.26
That's a great start, but JSON output would be easier to parse. Just use the Logstash output format. Our request becomes:
To use the Logstash format with Lograge, install gem #2: logstash-event.
Quick Start
Add the following to your Gemfile:
Configure Lograge via a config/initializers/lograge.rb file:
Adding custom fields
Back to the original problem: a single user is reporting a performance problem. It would be great if we could find every request that user sent to our app: this well tell us - definitively - if our Rails app was slow.
Here's how we log custom fields at Scout:
1. Accumulate fields in a Thread local variable
We accumulate important fields to store in a Thread local variable via a before_filter. Here’s how we store the current user:
2. Subscribe to processaction.actioncontroller events
These events are sent when Rails completes serving a request. We subscribe to these, adding additional fields collected while processing the request.
Now that we're logging data from other request in JSON format, we're ready to move onto analyzing that data. For that, I'll use Jupyter Notebook.
Jupyter Notebook
Jupyter Notebook is a bit like Google Docs, but for a data scientist. We'll write code snippets, leveraging the Pandas Python library, to generate helpful analysis and visualizations of the data in our Rails log file.
Installing Jupyter Notebook
Follow this guide to install Jupyter Notebook and the required data science libraries.
Importing the Rails log into Jupyter
After grabbing a Rails log file generated from the steps above, fire up Jupyter Notebook and create a new notebook:

Ultimately, we want to import the data into a Pandas Dataframe. A dataframe stores the request data in a tabular data structure that we can query and do all sorts of data science on. It's like a spreadsheet: a set of columns and rows with data in each column.
I'm utilizing the json_normalize() function to import the Rails log into a Pandas Dataframe. Rather than walking you through this required plumbing, I'll point you to my Jupyter Notebook that loads this data:
Notebook file | Notebook file in markdown format
High-level view of the data
After loading the data into a Pandas Dataframe (see above), I can get to work. First, I'll sanity check the data via Dataframe.head:
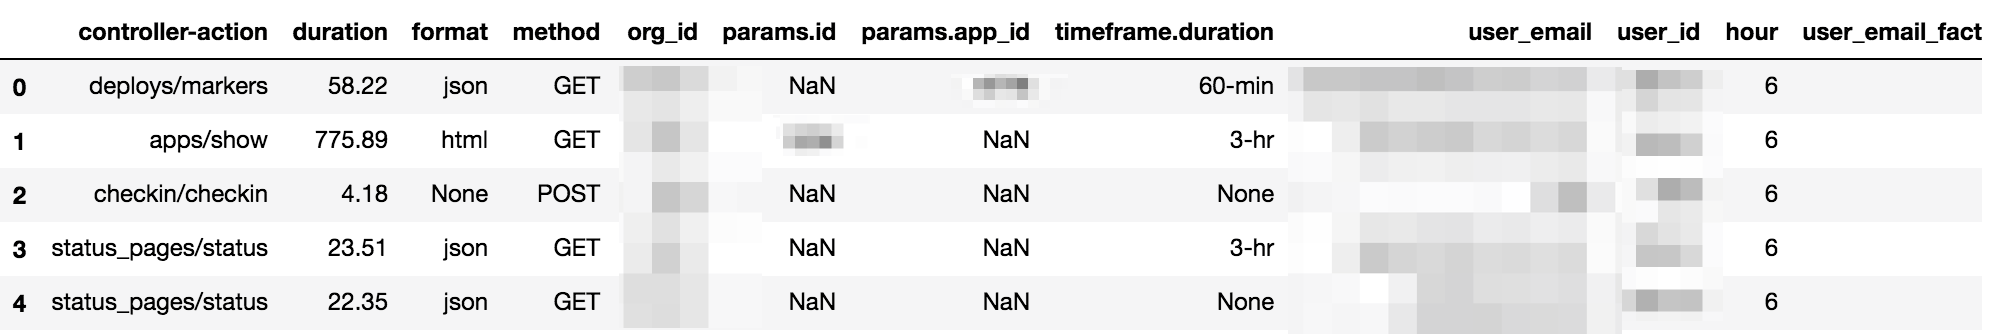
I've got columns and rows of requests. Looking good!
Next, I'll look at the data in aggregate. I'll use Dataframe.describe:
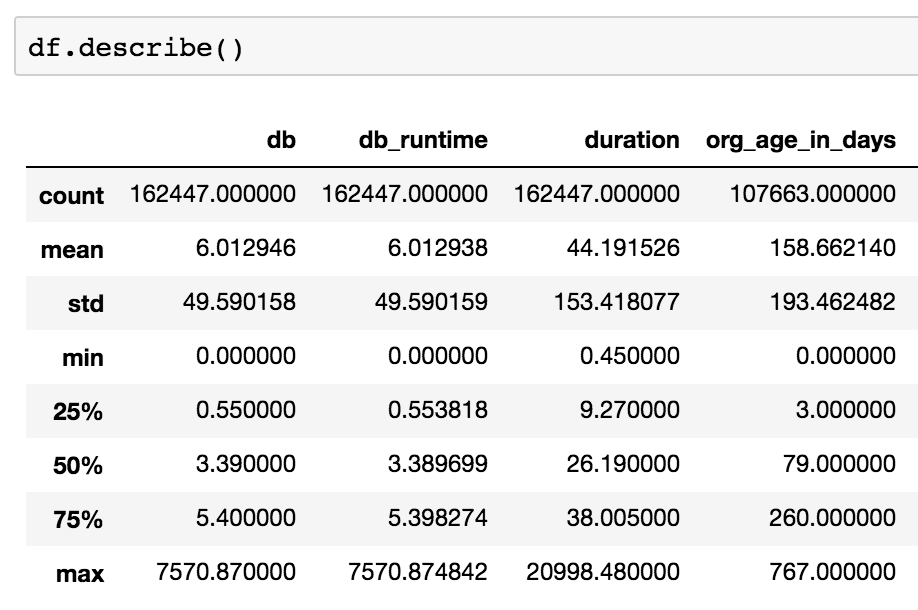
This analyzes the columns in the data set. In one shot, I've learned:
- The Rails app processed 162,447 requests over this one-day period
- The mean time spent in the database per-request is 6 ms
- The mean request duration is 44.2 ms
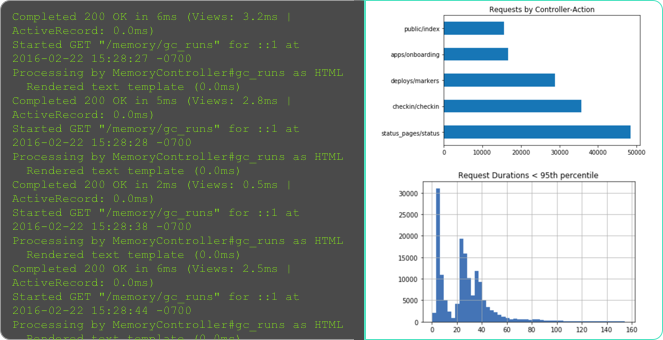
Here's a histogram of response times, filtering out slow outliers:
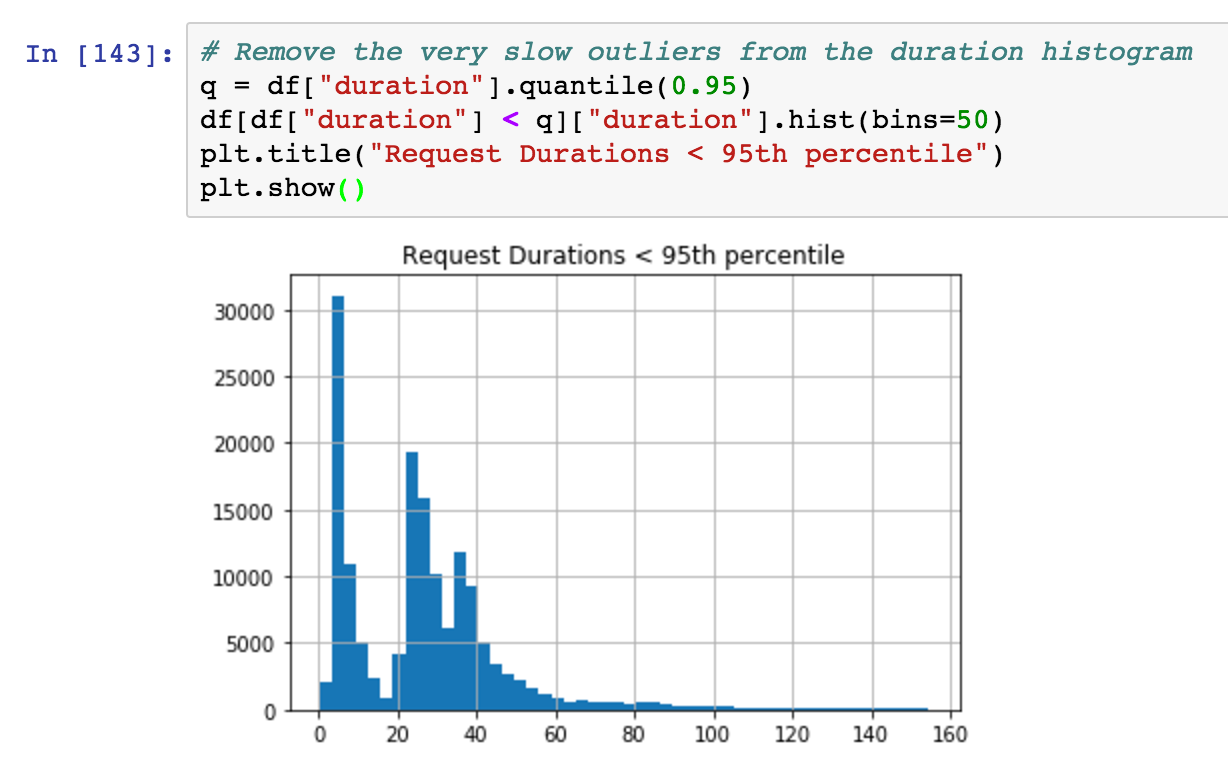
On the surface, nothing is alarming in this aggregate data. Our monitoring isn't broken.
So, is our important customer (Dave) not being truthful about our response times?
Finding all requests from one user
Before I drag Dave under the bus, let's see the performance of our app from his perspective.
I'm going to filter the data so I can see just those requests experienced by dave@scoutapm.com. I'm able to do this as our app has a user_email custom field:
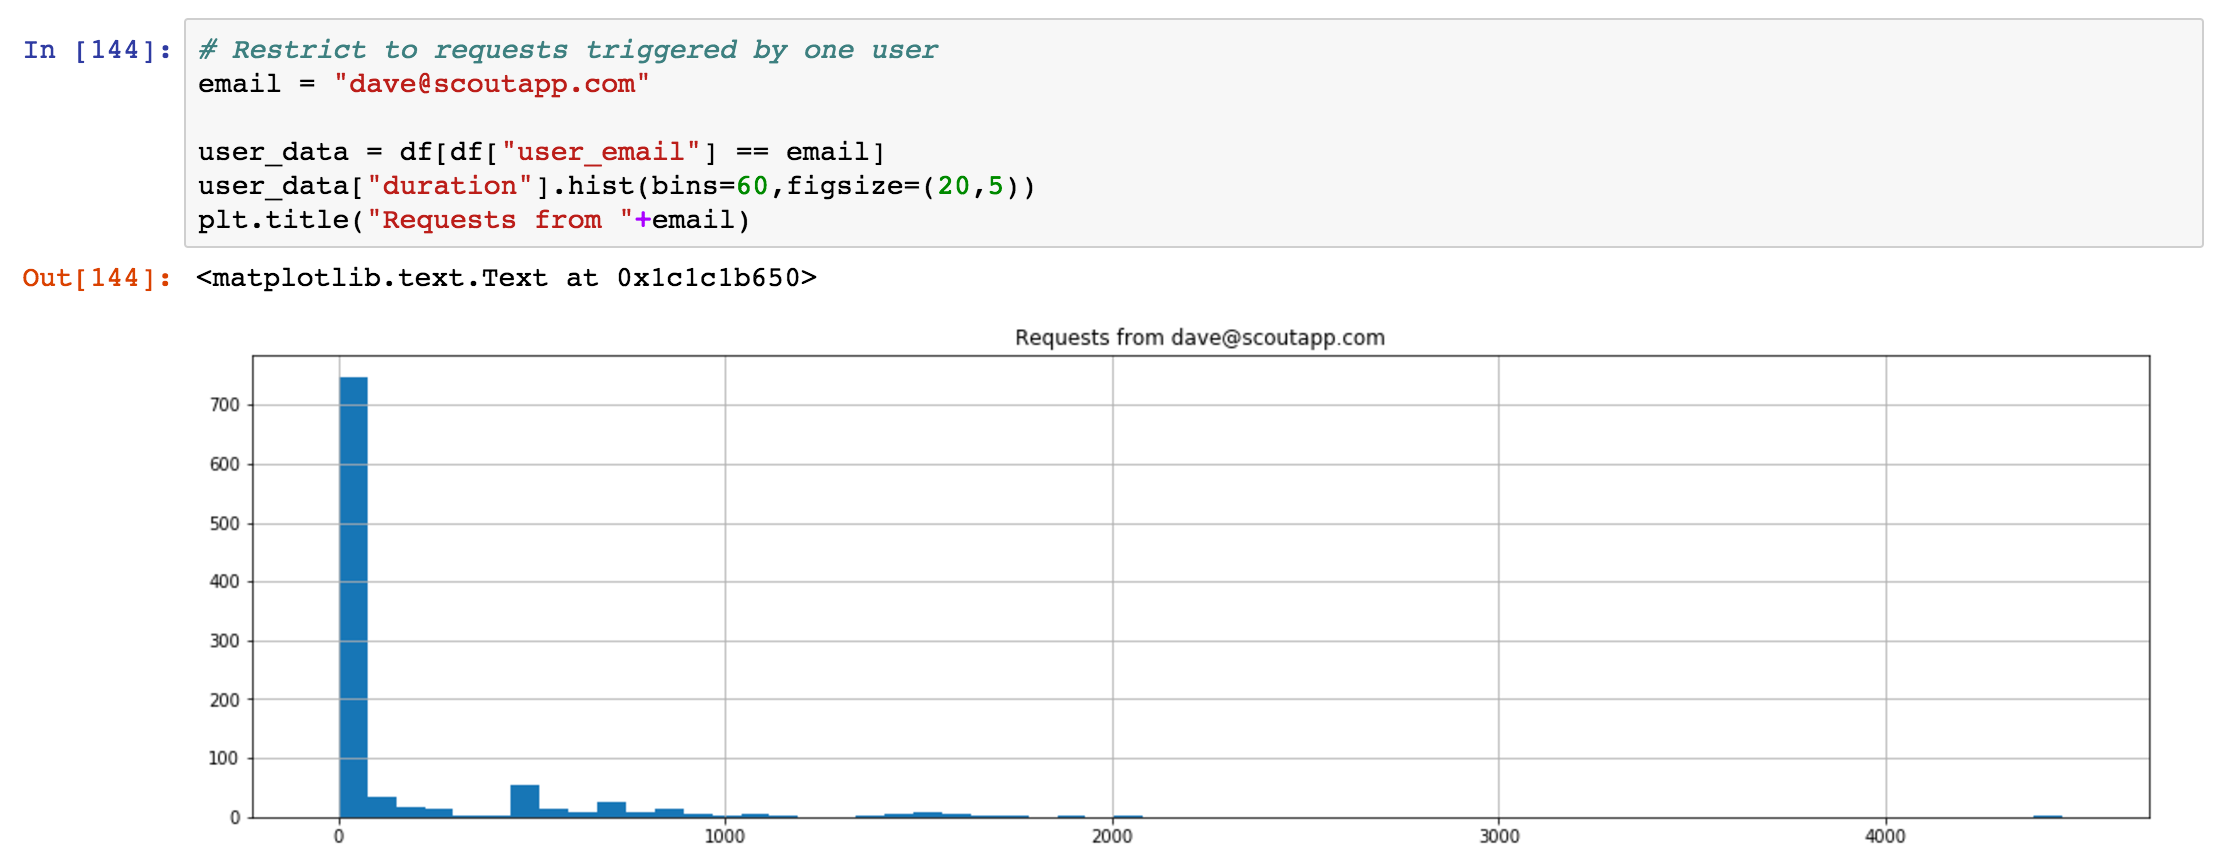
Again, nothing crazy: most of dave@scoutapm.com's requests execute in under 500 ms. Let's look at which controller-actions this user is accessing when the response duration is >= 1 second:
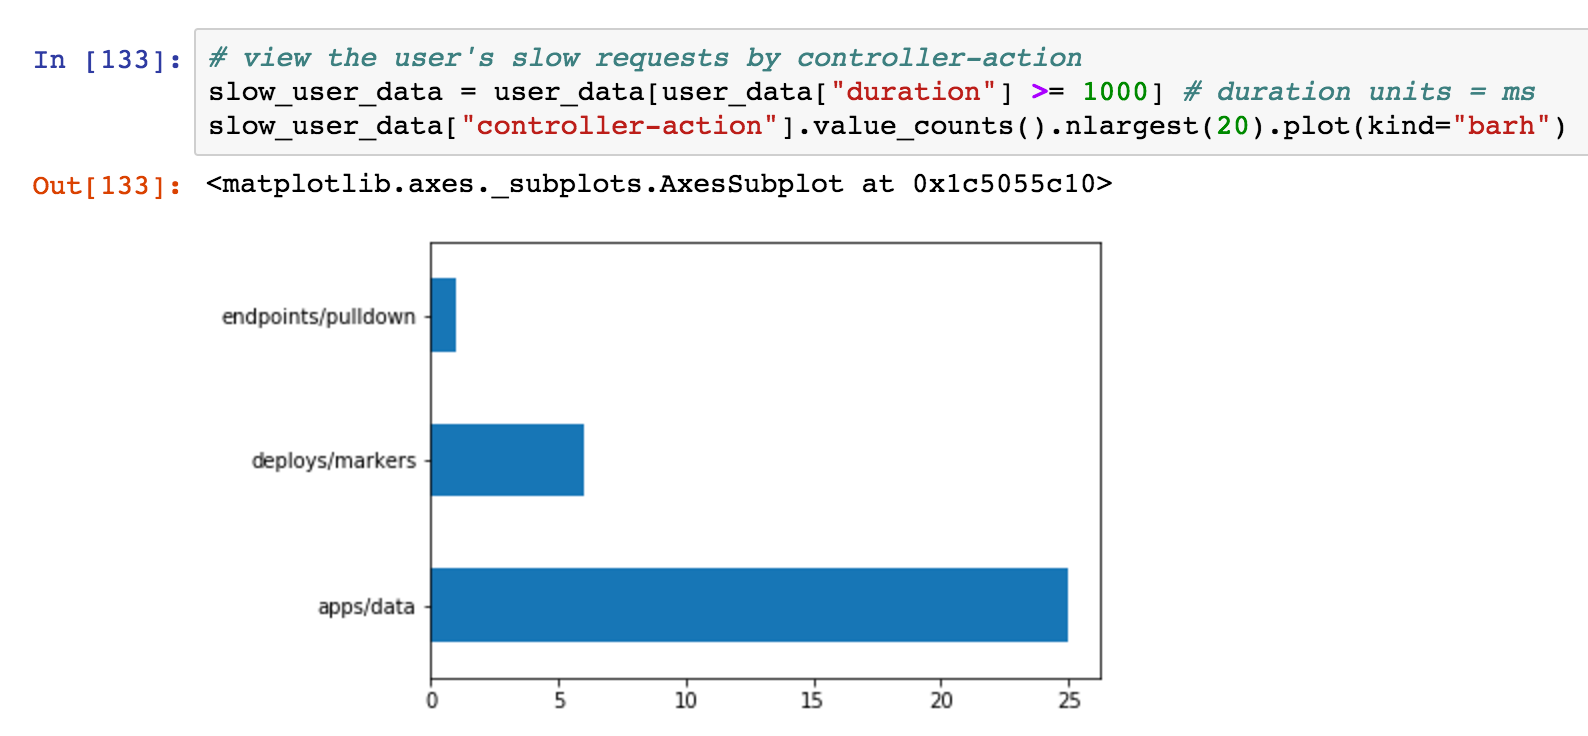
Now we're getting somewhere! apps/data is the most frequent slow controller-action for this user. This endpoint loads monitoring data for an app specified via params[:id]. This is a critical part of our app UI: if this is slow, his experience will feel pokey.
Dave was not being mischievous!
Might some specific apps - potentially those with more data - load slower?
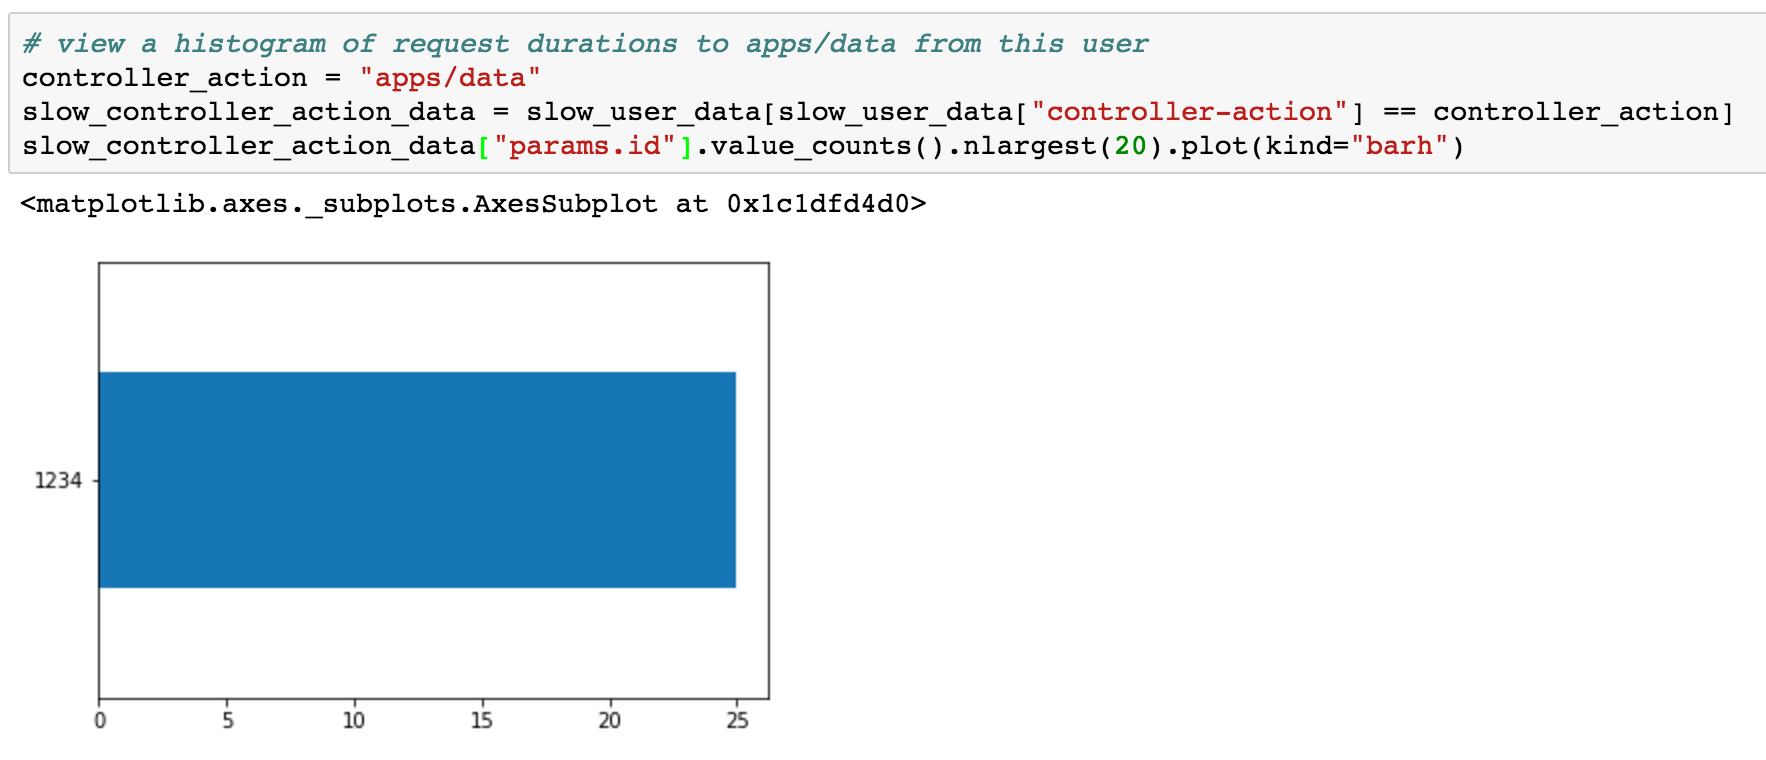
Just one app! All of the slow requests to apps/data are for params[:id]=1234.
What do I know now?
Using the above process, I've learned the specific conditions where Dave is seeing the majority of his slow requests:
- accessing the
apps/datacontroller-action - using
params[:id]=1234
Dave was not wrong! Our overall monitoring data wasn't wrong! It was just hard to see the behavior of one user with so much data.
Takeaways
Performance woes can seem random at first. However, many of these problems are easily reproducible once you identify the triggers.
Jupyter Notebook+Pandas is a low-effort approach for digging through a Rails log.