Performance Impact of Using Ruby on Rails View Partials
 Pawel Urbanek
on
November 03, 2020
Pawel Urbanek
on
November 03, 2020

This article was written by a contributor special to Scout APM.
Ruby on Rails view partials can help keep your codebase DRY (Don’t Repeat Yourself) but misusing them can have a significant performance impact. In this blog post, I’ll describe when you should avoid using view partials and the alternatives.
Measuring The Performance Impact
Let’s start by checking how much slower your app could be when running on partials. I’ve tested the Ruby 2.7, Rails 6 app using Siege. The app was configured in the production environment with Puma server, running locally to eliminate the networking overhead. The hardware was a 15 inch MacBook Pro with 2.2 GHz and 16GB RAM.
Simplified code for the tested endpoint looks like this:
class PostsController < ApplicationController
 def index
 @posts = Post.order(:created_at).limit(1000)
 end
end
The example is using 1000 objects, but this is a purposeful exaggeration. Relative performance differences would be the same with a smaller sample size.
We’re testing this endpoint using the following Siege script:
siege --time=30s --concurrent=10 http://localhost:3000/posts I’ve tested four cases: rendering detail partials one by one, using collection API, using collection API with embedded subpartials, and rendering the data inline. Let’s discuss them one by one:
Rendering Partials One-by-One
We’ll start with the most straightforward approach to using partials. Just put them in an each loop, and you’re good to go:
app/views/posts/index.html.erb

<% @posts.each do |post| %>
 <%= render 'post', post: post %>
<% end %>

app/views/posts/_post.html.erb

<% @posts.each do |post| %>
 <%= render 'post', post: post %>
<% end %>
Here’s the result of a Siege performance test:
Transactions: 119 hits
Response time: 2.39 secs
Transaction rate: 4.01 trans/sec
Throughput: 0.23 MB/sec
Successful transactions: 119
Failed transactions: 0
Longest transaction: 3.14
Shortest transaction: 0.65
Response time varied between 650ms and 3140ms, with an average at 2390ms. This is an unacceptable performance so let’s see how we can improve it.
Using the collection API
In the previous example, for every single object, Rails had to do an inefficient file read IO operation. Accessing the file system is an order of magnitude slower than reading data from memory.
To speed up the endpoint, you can use the collection option for the render method. It eliminates each loop and performs only a single slow file read IO operation.
app/views/posts/index.html.erb

                            <%= render partial: 'post', collection: @posts, as: :post %>
Here’s the Siege report:
Transactions: 862 hits
Response time: 0.34 secs
Transaction rate: 28.89 trans/sec
Throughput: 1.57 MB/sec
Successful transactions: 863
Failed transactions: 0
Longest transaction: 0.74
Shortest transaction: 0.24
This is significantly faster than iterating over partials one by one. Response time varied between 240ms and 740ms, with an average of 340ms. That’s already an acceptable performance for most applications, but we can do better.
collection API with Embedded Partials
“Partials all the way down.” might seem like a good idea. It keeps things even more DRY and maintainable.
I’ve run the performance test for the scenario where the top partial uses a collection API, and another partial is rendered inside the _post.html.erb partial.
app/views/posts/_post.html.erb

<h3><%= post.title %></h3>
<%= render 'post_detail', post: post %>

app/views/posts/_post_detail.html.erb

<p><%= post.content %></p>
Here are the results:
Transactions: 98 hits
Response time: 2.83 secs
Transaction rate: 3.36 trans/sec
Throughput: 0.19 MB/sec
Successful transactions: 98
Failed transactions: 0
Longest transaction: 4.13
Shortest transaction: 1.06
The response time varied between 1060ms and 4130ms, with an average of 2830ms. As you can see, if you use subpartials, even the collection API cannot speed up the performance.
Rendering Data Inline
Let me show you the least DRY of all the options. You can render all the posts data inline without using partials at all:
<% @posts.each do |post| %>
 <h3><%= post.title %></h3>
 <p><%= post.content %></p>
<% end %>
Here are the test results:
Transactions: 1107 hits
Response time: 0.27 secs
Transaction rate: 37.20 trans/sec
Throughput: 2.02 MB/sec
Successful transactions: 1108
Failed transactions: 0
Longest transaction: 0.41
Shortest transaction: 0.05
Response time is significantly faster compared to using the collection API. Under a smaller load, we could expect the response times at around 50ms. Because the test was done under a heavy load, the average response time was 270ms.
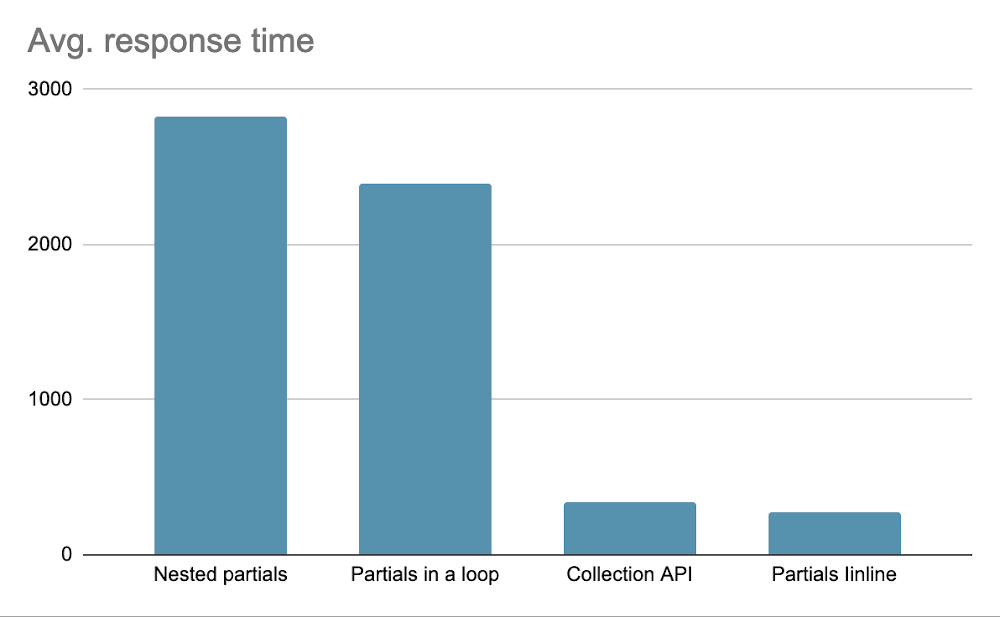
Let’s compare the average response time for all the methods:
It is not clearly visible because of the scale, but Partials inline are ~25% faster than the Collection API.
Now we know rendering data inline is the most performant option. Let’s see how we can make it more maintainable using the presenter pattern.
Presenter Pattern
To ensure maximum performance for your bottleneck endpoints, you must limit the number of slow file read IO operations to a minimum. It means that you should not use partials for rendering collections data but always embed the HTML snippets inline.
Putting all the logic into a single view file could quickly lead to an unmaintainable mess. You can extract parts of logic to easily testable objects using the presenter pattern.
A popular tool for presenters in Rails is an infamous Draper gem. I don’t recommend using it. It’s heavyweight and no longer actively maintained. Instead, you can add a custom lightweight presenter class using a built-in SimpleDelegator helper.
Imagine you are working with the following view template:
app/views/index.html.erb

  <% @posts.each do |post| %>
                        <h3 class="<%= post.featured? ? 'featured' : 'standard' %>"

   <% if post.anonymous? %>
   <p>Anonymous</p>
   <% else %>
   <p>Posted by: <%= post.author %></p>
   <% end %>

   <p><%= post.content %></p>
  <% end %>
Let me show you how to improve it using a simple presenter. Start with adding a presenter class:
app/presenters/post_presenter.rb

class PostPresenter < SimpleDelegator
 def title_class
 if featured?
 "featured"
 else
 "standard"
 end
 end

 def display_author
 if anonymous?
 "Anonymous"
 else
 "Posted by: #{author}"
 end
 end
end
Your presenter objects should not contain the HTML markup itself. If you’re rendering HTML from Ruby code, you must always use the sanitize method to prevent the XSS attacks. XSS is listed among the top ten OWASP application security risks. The successfully executed attack can result in taking over the victim's account, changing your website's contents, or redirecting users to malicious sites.
When testing, I’ve noticed that manually running sanitize on large collections is very slow. As long as you keep HTML only in the template, Rails takes care of XSS protection in a performant way.
Add the following method to the model:
app/models/post.rb

def decorate
 PostPresenter.new(self)
end
Now your template can look like this:
<% @posts.each do |post| %>
 <% post = post.decorate %>
 <h3 class="<%= post.featured_class %>"><%= post.title %></h3>  <p><%= post.display_author %></p>

 <p><%= post.content %></p>
<% end %>
You can extract all the logic to the presenter class and treat your templates as pure HTML scaffold layer. It will make them more maintainable in the long run, as your app starts growing more complex.
If you are planning to use presenters for more of your models, you can extract this logic to a reusable module to enforce naming convention for your presenter classes:
app/concerns/presentable.rb

module Presentable
 def decorate
 "#{self.class}Presenter".constantize.new(self)
 end
end
Detecting Slow Partials Using Performance Monitoring Tools
The approach described above should never be your go-to solution. It only makes sense for bottleneck endpoints that have an impact on your apps overall performance. First limit the size of the rendered collection by adding pagination. Only resort to the optimization technique described if this is not applicable.
Let’s see how we can detect endpoints that need this kind of treatment. ScoutAPM offers a simple way to list HTTP endpoints sorted by how much of the application’s time they consume:
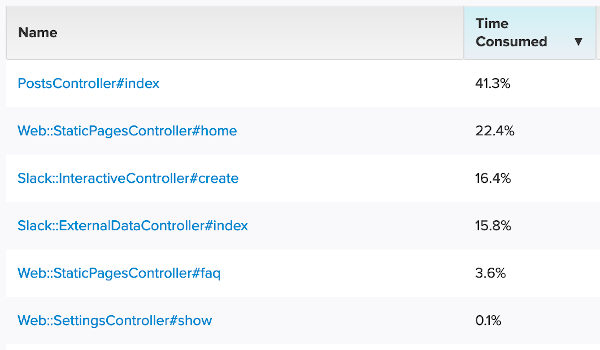
You can now analyze in which response layer the endpoint spends most of its processing time.
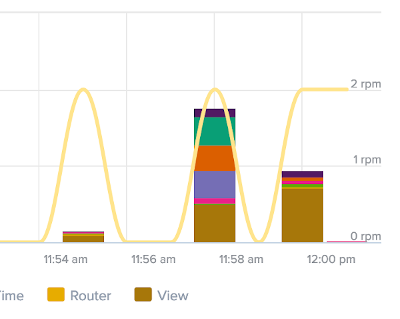
If the View layer is too slow, you should drill down into analyzing the endpoint’s Traces.
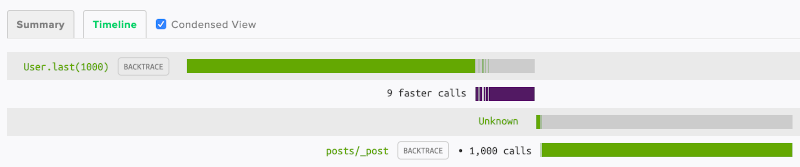
On this screen, you can see which partial was rendered how many times. To improve performance you can rewrite this endpoint to use the collection API or inline HTML with the presenter class for more extreme cases.
Summary
Never treat the DRY philosophy as the ultimate tool for the well-written codebase. It’s better to repeat yourself than to ship an app with mediocre performance. Always measure the performance impact of various programming patterns using performance monitoring tools.
Follow the author, Pawel Urbanek, on his blog here.